Abstract
Effective communication of forecast uncertainty is critical for public understanding and decision-making. In macroeconomic contexts, inflation forecasts are widely communicated, yet the role of uncertainty visualisations remains underexplored in this realm. This research employed a survey-based randomised control trial to evaluate
how UK public interprets probabilistic forecasts presented in various formats. Additionally, it explored, from a behavioural economics perspective, how uncertainty information is internalised and used to shape decisions. As part of a broader research agenda, the single lead-time inflation survey was first launched with 330 UK participants. Four visual formats—error bars, density strips, fan chart slices, and bell curves—were tested against a control condition. Results show that communicating uncertainty enhances interpretation accuracy relative to the control, though no format consistently outperformed others across all dimensions. Visually dense formats were perceived as harder to understand and less effective for decision-making. Thematic analysis of decision rationale reveals reliance on heuristics and exhibits loss and risk aversion. By revealing how the public interprets and utilises inflation forecast uncertainty, these findings offer valuable insights for economists, forecasters and communicators to design effective, user-centred communication tools that align public expectations and empower the the public to make informed financial decisions without the risk of misinterpretation.
how UK public interprets probabilistic forecasts presented in various formats. Additionally, it explored, from a behavioural economics perspective, how uncertainty information is internalised and used to shape decisions. As part of a broader research agenda, the single lead-time inflation survey was first launched with 330 UK participants. Four visual formats—error bars, density strips, fan chart slices, and bell curves—were tested against a control condition. Results show that communicating uncertainty enhances interpretation accuracy relative to the control, though no format consistently outperformed others across all dimensions. Visually dense formats were perceived as harder to understand and less effective for decision-making. Thematic analysis of decision rationale reveals reliance on heuristics and exhibits loss and risk aversion. By revealing how the public interprets and utilises inflation forecast uncertainty, these findings offer valuable insights for economists, forecasters and communicators to design effective, user-centred communication tools that align public expectations and empower the the public to make informed financial decisions without the risk of misinterpretation.
Visualisations Assessed
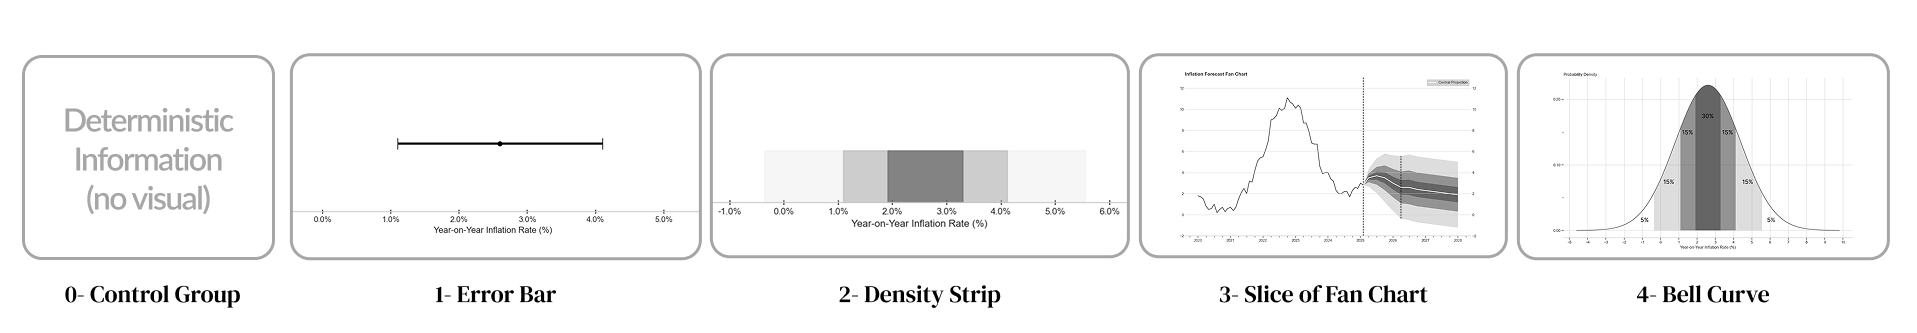
Single lead-time inflation forecast
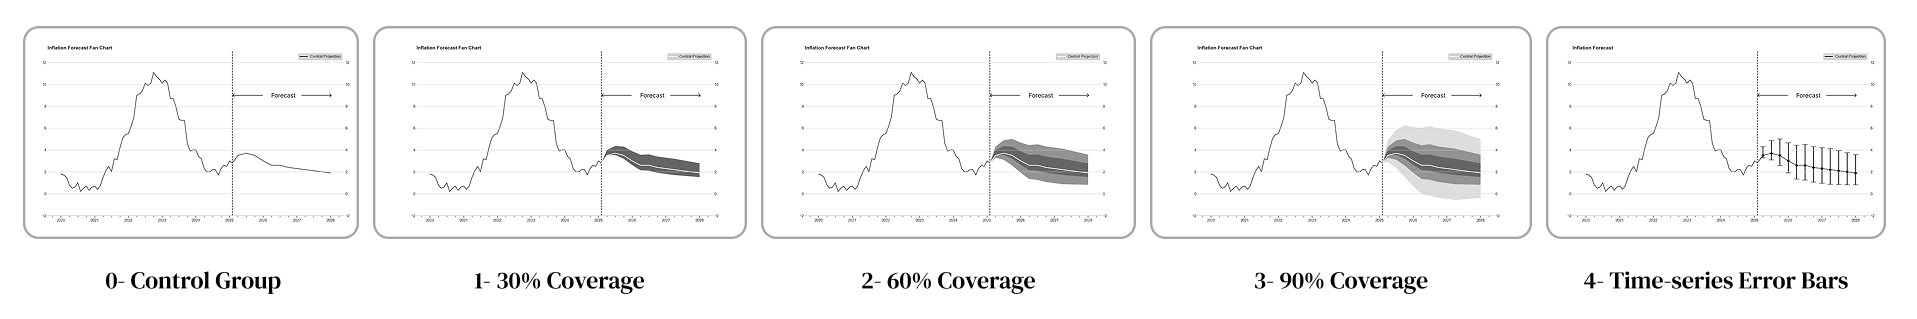
Time-series inflation forecast (3 year ahead)
Key Insights
• People generally expected high uncertainty around the central estimate. Although only a minority of respondents understood that the probability of inflation being any exact value is 0 in a statistical sense, most respondents intuited the inflation outcome being exactly the central estimate as ’very unlikely’.
• The interpretation accuracy of probabilistic forecasts (i.e. respondents’ understanding of analytical uncertainty) significantly improved with visual uncertainty communication.
• In the absence of uncertainty visual aids, participants anchored their expectations on the point estimate, exhibited a stronger upward bias, and assigned lower probabilities to extreme outcomes.
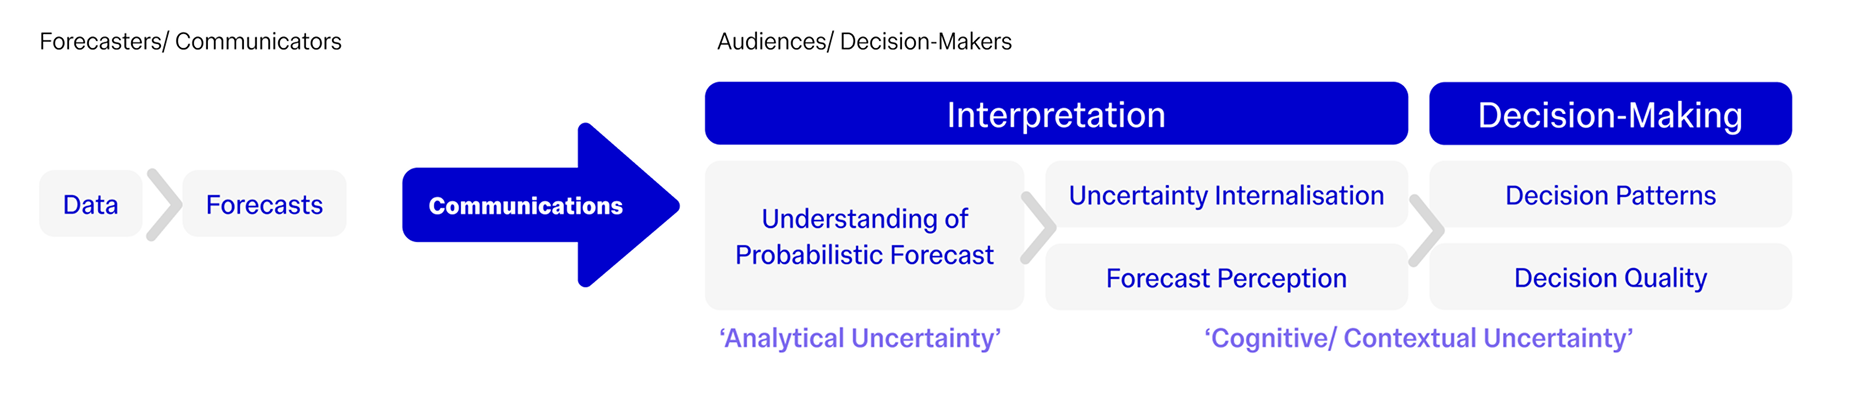
• Communication tools had little influence on the forecast’s cognitive (or contextual) uncertainty (i.e., how participants internalised the forecast and utilised it to support decisions).
• A clear disconnect emerged between objective probability comprehension (analytical uncertainty) and subjective, self-reported uncertainty (contextual uncertainty).
• Loss aversion is prominent in economic decision-making under macroeconomic forecast uncertainty.
• No single visual format consistently outperformed others across all metrics, suggesting selection of communication tools could take into account the prioritisation of specific key objectives.
• The perceived accuracy and certainty of the central estimate as well as the representativeness of the uncertainty showed no significant differences across groups.
• Information-dense uncertainty visualisations were perceived as more difficult
to understand and less helpful for decision support.
• Uncertainty communication does not erode trust in the forecast.
Presentation @ the 45th International Symposium on Forecasting